
Evaluation Metrics
- Dice Similarity Coefficient
- Normalized Surface Distance
- Running time
- Resource consumption, including Area under GPU memory-time curve and Area under CPU utilization-time curve.

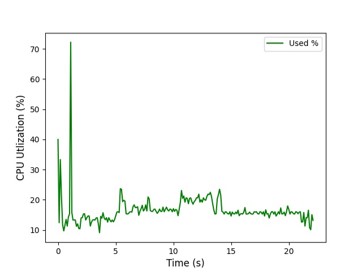
We record the GPU memory and GPU utilization every 0.1s. The Area under GPU memory-time curve and Area under CPU utilization-time curve are the cumulative values along running time.
If the docker container gets stuck, the corresponding metrics will be set to the worse values: DSC=0, NSD=0, Time=3600, AUC GPU=3600*(1024*10-2048)=29491200, AUC CPU=3600*100=360000
All metrics will be used to compute the ranking. To encourage participants developing GPU-based solutions, we give GPU memory consumption a 2GB tolerance #GPU Memory = max(0, Real GPU Memory-2048MB). In other words, if the maximum GPU memory consumption is within 2048MB, you will get perfect scores in Area under GPU memory-time curve.
The evaluation code is available on Google Drive or GitHub.
Evaluation Platform
The submitted docker containers will be evaluated on a Ubuntu 20.04 desktop. Detailed information is listed as follows:
- CPU: Intel® Xeon(R) W-2133 CPU @ 3.60GHz × 12
- GPU: NVIDIA QUADRO RTX5000 (16G)
- RAM: 32G
- Driver Version: 510.60.02
- CUDA Version: 11.6
- Docker version 20.10.13
Ranking Scheme
To keep the balance between accuracy metrics and efficiency metrics in the ranking scheme, we assign half weight to CPU and GPU metrics. The ranking scheme includes the following three steps:
- Step 1. Compute the five metrics for each testing case.
- Step 2. Rank participants for each of the 200 testing cases and each metric; Thus, each participant will have 200x5 rankings.
- Step 3. Average all these rankings (GPU and CPU metrics have half weights).
ChallengeR will be used to analyze and rank the results. https://github.com/wiesenfa/challengeR